

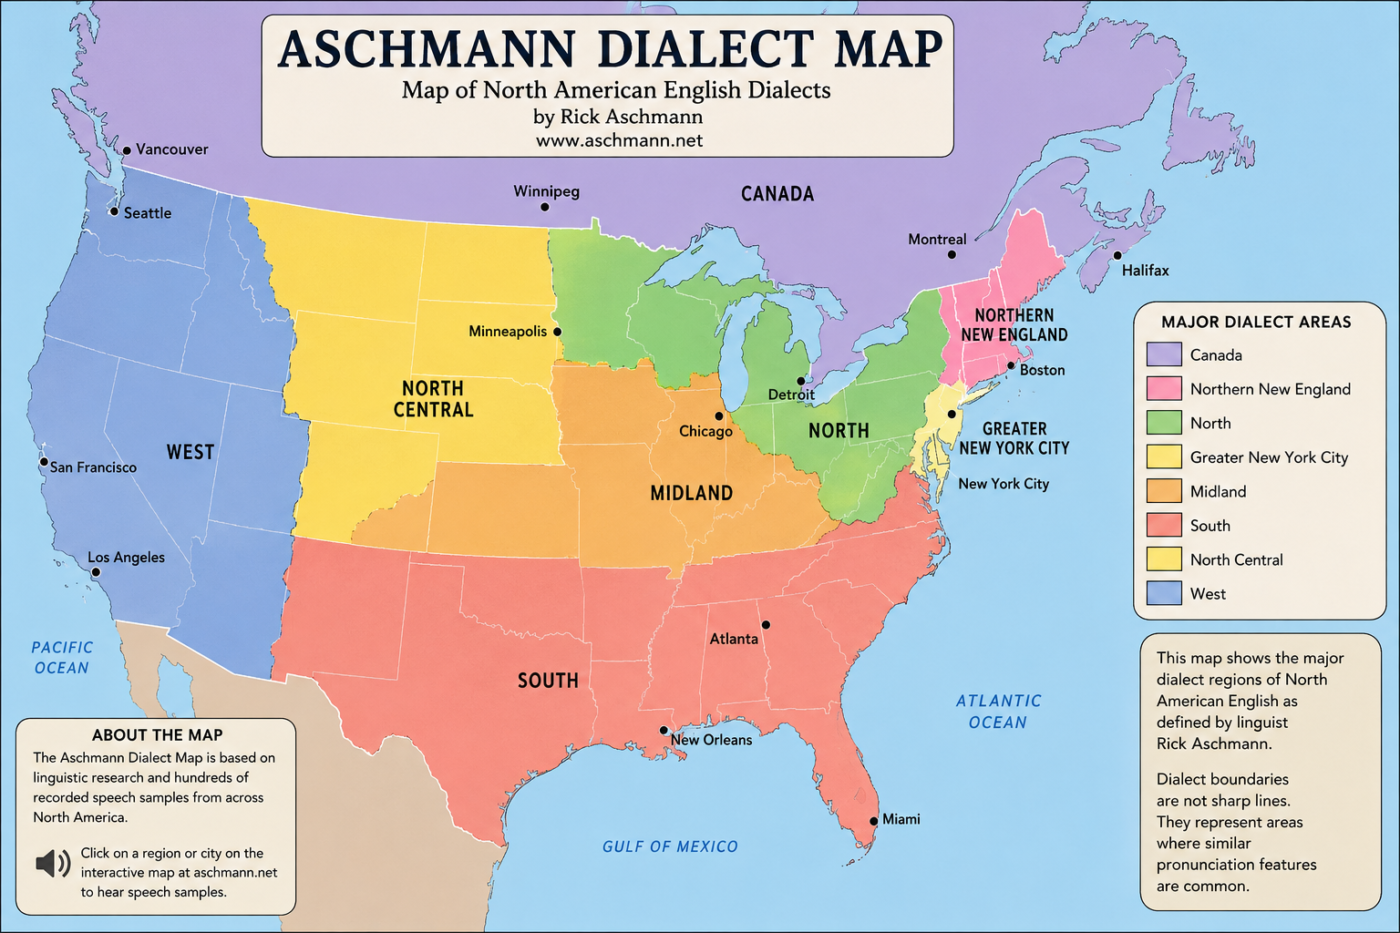

Language can reveal far more about a person’s background than vocabulary alone. A particular vowel sound, pronunciation pattern, or regional expression can sometimes hint at where someone grew up. This fascinating connection between geography and speech is the foundation of the Aschmann dialect map, an extensive visual guide to North American English dialects created by linguist Rick Aschmann.
Rather than treating American English as one uniform system, the map divides the United States and Canada into major dialect regions and numerous subdialects. It also connects locations with audio and video examples, allowing users to hear how pronunciation varies from one place to another. Aschmann explains that the project began as a personal hobby and developed into a detailed resource containing hundreds of speech samples.
For anyone interested in linguistics, regional accents, American culture, or the history of English, this map offers an unusually practical way to explore language variation.
What Is the Aschmann Dialect Map?
The Aschmann dialect map is an interactive map of North American English organized primarily around pronunciation patterns. It covers the United States and Canada and identifies major dialect areas, smaller regional varieties, and transitional zones.
The aschmann dialect map distinguishes eight major English dialect areas in North America. These include Canada, Northern New England, the North, Greater New York City, the Midland, the South, the North Central region, and the West. Within these broad categories, Aschmann identifies numerous subdialects.
This structure is important because regional speech rarely follows state boundaries. People living on opposite sides of a state line may share similar pronunciation, while communities within the same state can have noticeably different accents.
The map therefore presents dialect as a geographical continuum rather than a collection of rigid political divisions.
Who Created the Map?
Rick Aschmann created the project as a personal interest in collecting and documenting dialects. His website describes the project as a hobby rather than his primary professional field. Nevertheless, the resulting resource has become a widely referenced online guide to North American English variation.
Aschmann combines information from several sources. A aschmann dialect map major foundation is the Atlas of North American English, associated with William Labov, Sharon Ash, and Charles Boberg. Aschmann also incorporates his own research, analysis, pronunciation observations, and audio material.
Importantly, Aschmann notes that he created some of the dialect names himself and adjusted several boundaries. That means the map should be understood as an interpretive linguistic resource rather than an official government-style classification.
How the Map Works
One of the most useful features is its interactive design. Users can select different portions of the United States or Canada and explore individual locations.
Many cities and towns are connected to recordings from speakers associated with those places. According to the project’s website, the collection has included more than 900 audio and video samples.
This makes the resource more useful than a static map. Instead of simply reading that a region has a particular vowel feature, visitors can hear examples of the speech themselves.
Major Dialect Areas
The aschmann dialect map eight major areas provide the map’s broad organizational structure. The first six regions generally reflect patterns of settlement moving westward from the eastern seaboard, while the North Central and Western regions represent major western areas.
The Northern area, for example, encompasses several varieties associated with the northern United States. The South contains multiple subregions rather than representing one single Southern accent. Meanwhile, the Midland region includes a broad collection of speech varieties across parts of the central and eastern United States.
The map also recognizes distinctive areas such as Greater New York City and Northern New England, where pronunciation can differ substantially from neighboring regions.
Why Dialect Boundaries Are Complicated
A common mistake is to imagine that everyone inside a colored region speaks exactly the same way. Real-world language does not work that neatly.
People move, interact, marry, attend school, consume the same media, and adopt features from neighboring communities. As a result, pronunciation gradually changes across geographical space.
Aschmann acknowledges this complexity directly. His website explains that the map contains many features and can appear complicated because the subject itself is complicated.
Some boundaries represent strong concentrations of particular speech characteristics. Others are better understood as transitional zones where linguistic features overlap.
This is why the Aschmann dialect map is most useful as a guide to patterns rather than as a tool for assigning every speaker to one precise category.
Pronunciation Patterns Behind the Map
Pronunciation is central to the map because small differences in vowel and consonant sounds can reveal regional patterns.
One well-known example is the pin-pen merger, in which certain speakers pronounce the vowels in words such as “pin” and “pen” similarly under particular phonetic conditions. Aschmann specifically discusses this feature in his map notes and says his interpretation differs from the Atlas of North American English in the extent of the area where he observes the merger.
Other distinctions involve vowel systems, pronunciation of particular word groups, and regional sound changes. These characteristics may not be obvious during casual conversation. However, linguists can analyze them systematically.
The aschmann dialect map map’s audio samples make these differences easier for non-specialists to appreciate because listeners can compare speakers directly.
The Importance of Audio Samples
A written description of an accent can only go so far. Hearing the pronunciation provides a much clearer understanding of regional variation.
Aschmann’s website allows visitors to click on many locations and access speech samples. The collection includes contributions from people raised in particular places, although being born in a location alone is not necessarily enough to make someone’s speech representative of that area.
This approach also highlights an important principle of dialect research: speech reflects social and geographical history.
For example, a community may preserve older pronunciation patterns because of historical settlement, while another area may develop newer features through migration and contact with surrounding populations.
Aschmann Map vs. Other Dialect Maps
The aschmann dialect map is not the only attempt to document American English. Academic projects such as the Atlas of North American English provide extensive linguistic research and systematic analysis.
The distinctive quality of Aschmann’s project is its accessibility. Instead of presenting dialectology exclusively through academic terminology, it combines geographical visualization with clickable recordings.
The map also draws substantially from the Atlas while adding Aschmann’s own observations and modifications. His website explicitly states that some dialect names and boundaries are his own.
This makes it particularly useful for casual learners, students, writers, actors, language enthusiasts, and anyone curious about American accents.
How to Use the Aschmann Dialect Map
Getting value from the map does not require advanced linguistic knowledge. Start by locating your hometown or a place where you spent much of your childhood.
Listen to available recordings and pay attention to vowel sounds, rhythm, and pronunciation. Then compare those samples with nearby regions.
You can also examine the dialect description chart to understand which characteristics distinguish one area from another. The website provides additional information about features that may not be immediately visible on the main map.
For a more interesting experiment, ask friends from different parts of the country to pronounce the same group of words. Compare their recordings with the map’s examples and see whether the predicted regional patterns appear.
What the Map Reveals About American Culture
Dialect maps are not merely pronunciation charts. They provide a window into migration, settlement, identity, and cultural history.
The aschmann dialect map distribution of American dialects has been influenced by waves of migration and long-term interaction between communities. Eastern dialect regions, for example, often preserve relationships with historical settlement patterns, while western varieties have developed through different combinations of migration and linguistic contact.
That is one reason the geographical organization of speech can be so revealing. The way someone pronounces a vowel may carry traces of where previous generations lived.
At the same time, modern mobility is gradually changing traditional boundaries. Large cities attract people from many backgrounds, while television, social media, education, and nationwide mobility expose speakers to linguistic patterns from across the country.
Is the Map Completely Accurate?
The aschmann dialect map is valuable, but it should not be treated as an absolute authority for identifying every person’s accent.
Dialect boundaries are inherently fluid. Individuals can have mixed linguistic backgrounds, and a person’s current accent may differ from the speech traditionally associated with their childhood community.
Aschmann himself presents the project as a detailed but evolving resource. His website records adjustments to map features, boundaries, labels, and samples over time.
Therefore, the best way to interpret the map is as a representation of broad linguistic tendencies supported by observations and research.
Why the Map Remains Interesting
The aschmann dialect map continuing popularity of the project demonstrates how strongly people connect language with identity. Recent online discussions and articles have again drawn attention to the map because people find it entertaining to test whether pronunciation can suggest where someone grew up.
The aschmann dialect map appeal is simple: everyone speaks, but not everyone speaks in exactly the same way.
A person may believe they have a completely neutral American accent until they compare their pronunciation with someone from another region. Suddenly, differences that seemed invisible become surprisingly obvious.
That makes dialect geography both educational and entertaining.
Final Thoughts on the Aschmann Dialect Map
The Aschmann dialect map offers an engaging way to understand the extraordinary diversity hidden within North American English. By combining geography, pronunciation research, dialect descriptions, and hundreds of speech samples, it turns an academic subject into something visitors can actively explore.
Its greatest strength is not that it can place every speaker into one perfect category. Instead, it demonstrates how language changes gradually across communities and how pronunciation can preserve clues about history, migration, and regional identity.
If you are curious about American accents, the aschmann dialect map is worth exploring with your ears rather than your eyes alone. Listen to several nearby regions, compare their vowel patterns, and consider how your own speech fits into the larger linguistic landscape. In doing so, you may discover that your everyday way of speaking carries a much richer geographical story than you ever realized.










Leave a Comment